Back // project
Revenue Prediction & Statistical Analysis Using Regression Modeling
Performed comprehensive exploratory data analysis and multiple linear regression to model revenue drivers, identifying order volume and average order value as key predictors with strong statistical significance.
Overview
This project analyzes business transaction data to identify key drivers of revenue using statistical and regression modeling. It addresses the problem of understanding revenue dynamics by combining exploratory data analysis, hypothesis testing, and predictive modeling.
Problem Statement
Businesses often struggle to pinpoint which operational variables most strongly influence revenue, limiting their ability to make data-driven decisions.
Solution & Features
- Comprehensive exploratory data analysis (EDA)
- Statistical summary metrics (mean, median, distribution, skewness, kurtosis)
- Correlation analysis between key variables
- Simple and multiple linear regression modeling
- Diagnostic testing of regression assumptions
- Interpretation of results for both academic and business contexts
- Creation of a Report and Dashboard using Power BI
Tech Stack
- R
- Tidyverse (readr, dplyr)
- e1071 (distribution metrics)
- lmtest (Durbin-Watson test)
- car (VIF analysis)
- gvlma (model validation)
- Power BI
Data Analysis Workflow
- Data Loading: Structured dataset with revenue, orders, and pricing features
- EDA: Statistical summaries and distribution analysis
- Correlation Analysis: Identified strong relationships between variables
- Regression Modeling: Built simple and multiple linear regression models
- Diagnostics: Tested assumptions (linearity, independence, normality, homoscedasticity, multicollinearity)
Key Findings
- Number of Orders is the strongest predictor of total revenue
- Average Order Value has a statistically significant positive impact
- Time (Month) does not significantly influence revenue
- Model explains ~98% of variance in revenue (R² ≈ 0.98)
- Strong correlation between revenue and order volume (≈ 0.94)
Development Highlights
- Built both simple and multiple regression models for comparison
- Applied rigorous statistical testing for model validation
- Identified distribution issues (skewness, kurtosis) affecting assumptions
- Demonstrated strong predictive capability despite real-world data limitations
Business Insights
- Revenue growth is driven primarily by increasing order volume
- Upselling and bundling strategies can improve average order value
- Seasonal timing has minimal direct impact on revenue performance
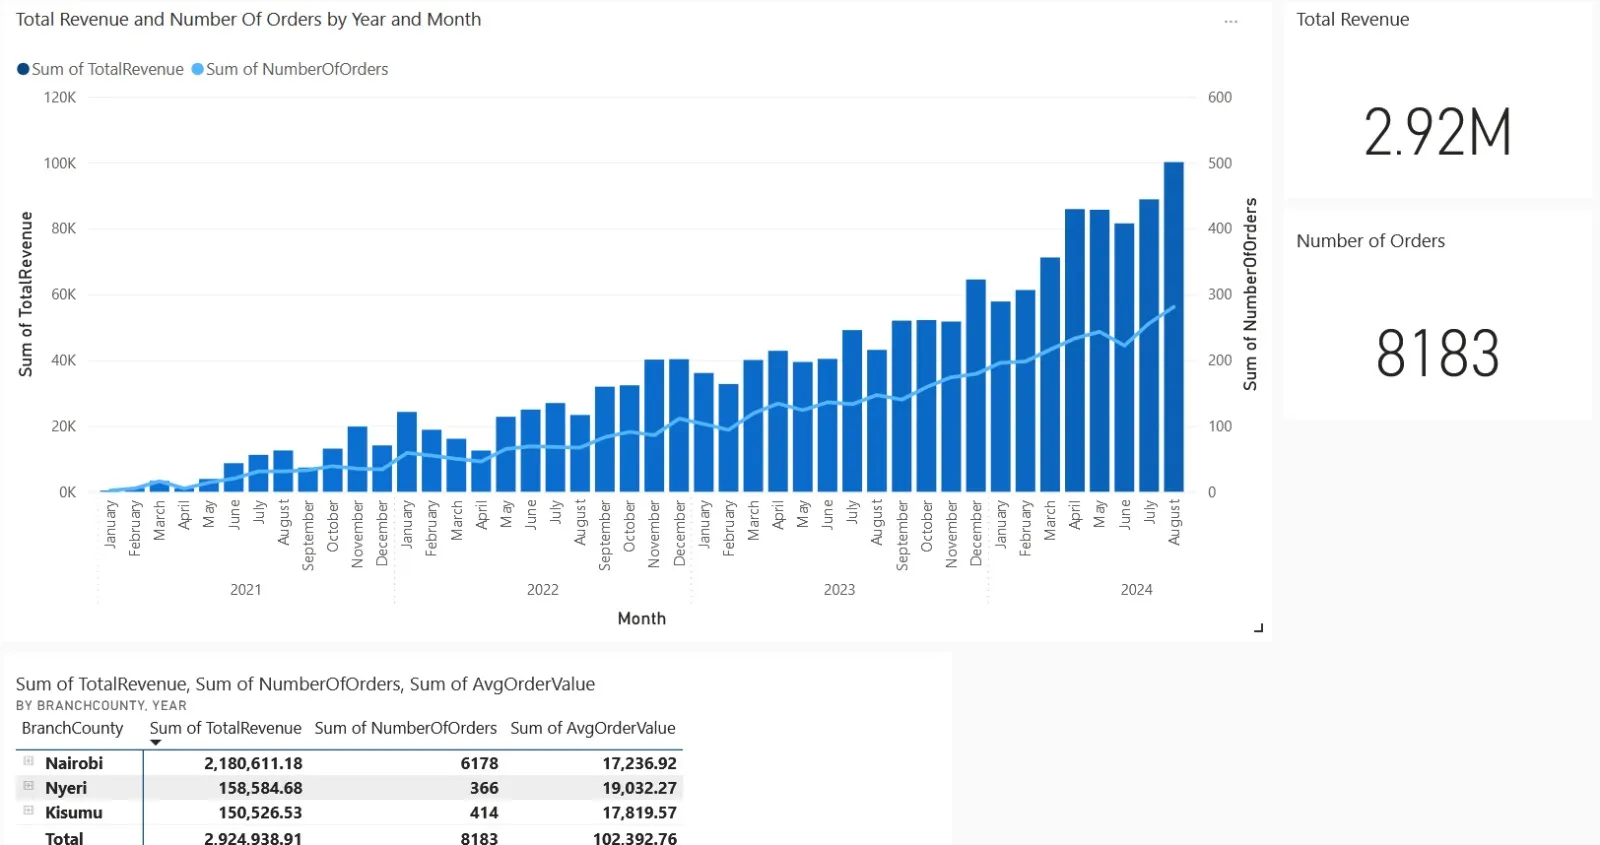
Power BI Dashboard
- A Power BI dashboard was developed to effectively visualize and communicate the analytical findings from this project.
Limitations
- Non-normal data distribution with high skewness and kurtosis
- Potential presence of outliers affecting statistical tests
- Linear modeling may not fully capture complex temporal patterns
- Limited feature set (no external or behavioral variables)
Future Improvements
- Apply data transformations to address non-normality
- Explore time-series or seasonal models for temporal effects
- Incorporate additional features (customer behavior, promotions)
- Test advanced models beyond linear regression